When thinking about the potential impact of scaling up PPFP interventions on national levels of contraceptive use, it is important to take several factors into consideration: what proportion of women in the country are postpartum in any given year and what baseline PPFP uptake looks like in the country. Places where a large proportion, or absolute number, of women of reproductive age area estimated to be postpartum and not using modern contraception present the largest opportunities for investments in PPFP to lead to growth in mCPR or modern users.
To learn more about levels of PPFPP uptake in countries, and see how this differs based on if women deliver at home or in a facility, visit our special analysis section on Postpartum Family Planning.
In this graph, the total height of the bar shows the proportion of all women of reproductive age in the country who are postpartum.1 The bar is then segmented by use of a PPFP method—overall, or, if you select the option below, you can split this based on where women deliver2. In countries where there is a large segment of postpartum non-modern users who delivered at home, community-based interventions may need to be prioritized, as these women could not be reached through facility-based PPFP integration.
Countries have been organized from largest to smallest % of WRA who are postpartum and not using modern FP. Those countries where postpartum non-users are a large proportion of the WRA offer the greatest potential impact on mCPR by doing PPFP interventions. However, country context must be taken into consideration- increasing PPFP uptake may be harder in some settings than others. In addition, we would never expect PPFP uptake to each 100%- based on existing data, the highest uptake is in Indonesia, which reaches about 70%. Therefore, not all the ‘non-users’ shown in the graph below have the potential to become users.
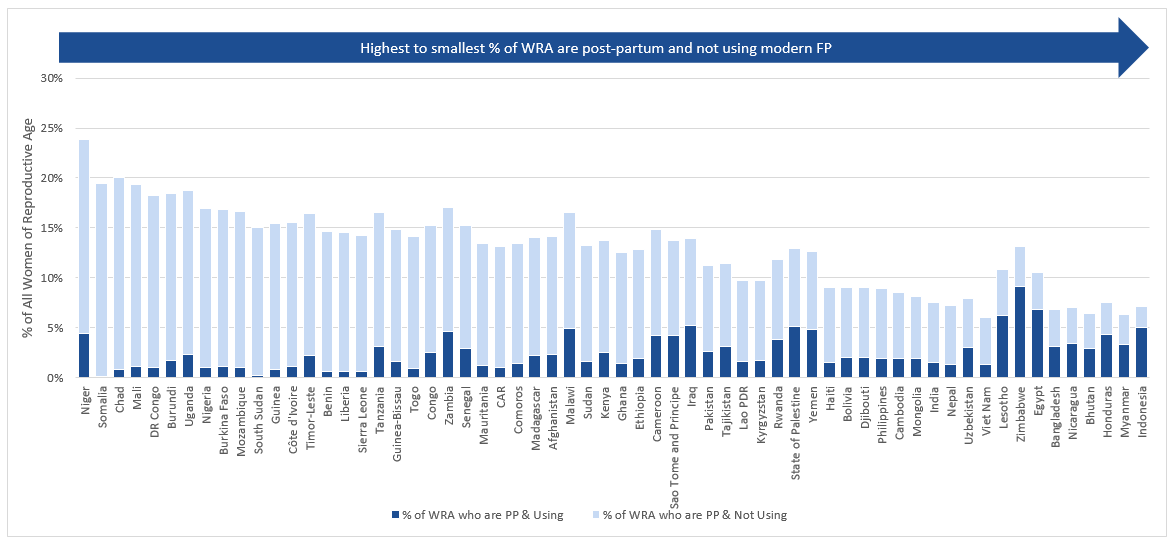
1This is calculated using UNPD WPP (2015 Revision) projections, as the number of births in 2016 divided by the total number of women of reproductive age in 2016, as a proxy for the % of WRA who will give birth in the year.
2This has been done based on secondary analysis of the latest DHS or MICS survey in each country (see sources tab)- for countries with a calendar this shows modern PPFP uptake at 6 months, for countries without a calendar, this shows the % of women who delivered in the last 6 months who are currently using a modern method.
In this graph, the total height of the bar shows number of women of reproductive age in the country who are postpartum.1 The bar is then segmented by use of a PPFP method—overall, or, if you select the option below, you can split this based on where women deliver2. In countries where there is a large segment of postpartum non-modern users who delivered at home, community-based interventions may need to be prioritized, as these women could not be reached through facility-based PPFP integration.
Countries have been organized from largest to smallest number of WRA who are postpartum and not using modern FP. Those countries where there are the largest absolute number of postpartum non-users offer the greatest potential impact on increasing modern contraceptive users by doing PPFP interventions. However, country context must be taken into consideration- increasing PPFP uptake may be harder in some settings than others. In addition, we would never expect PPFP uptake to each 100%- based on existing data, the highest uptake is in Indonesia, which reaches about 70%. Therefore, not all the ‘non-users’ shown in the graph below have the potential to become users.
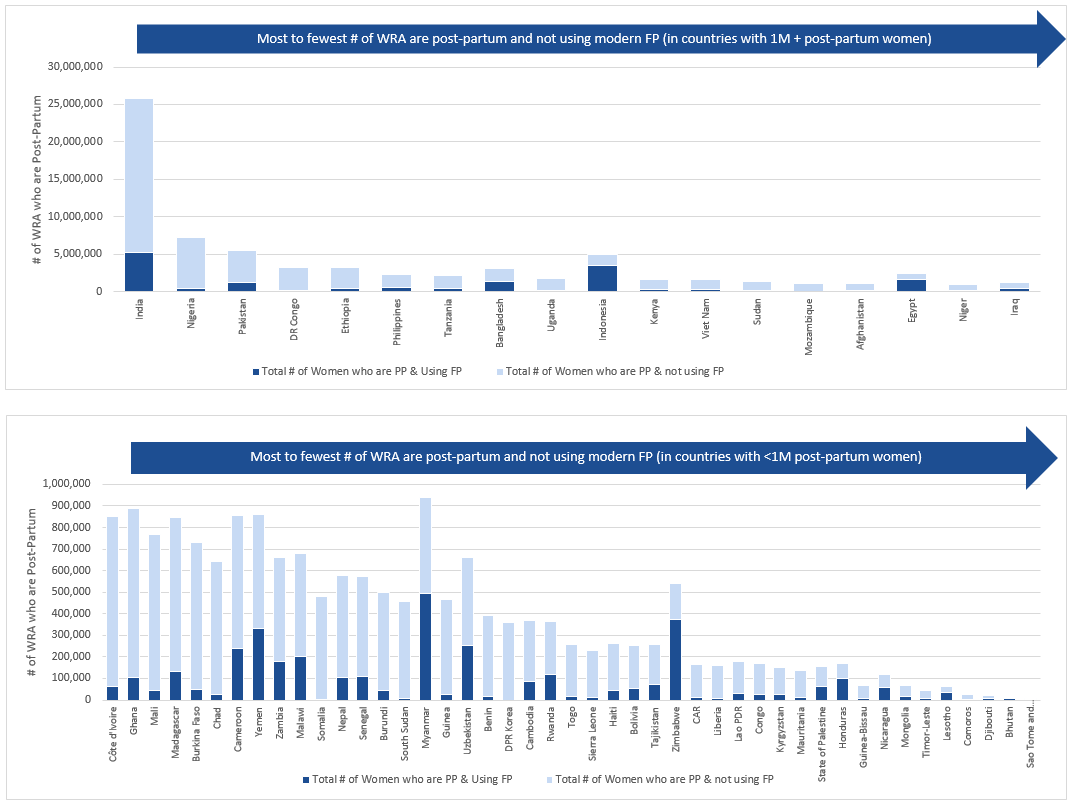
1This is calculated using UNPD WPP (2015 Revision) projections, as the number of births in 2016, as a proxy for the # of WRA who will give birth (and thus be postpartum) in the year.
2This has been done based on secondary analysis of the latest DHS or MICS survey in each country (see sources tab)- for countries with a calendar this shows modern PPFP uptake at 6 months, for countries without a calendar, this shows the % of women who delivered in the last 6 months who are currently using a modern method.