Track20's Family Planning Estimation Tool (FPET) is a web application that uses all available survey data to produce annual estimates for key family planning indicators, such as contraceptive prevalence and unmet need for family planning.
http://fpet.track20.org/To learn more about FPET and how it has helped countries track family planning progress and inform future programming, read the FPET Overview in English or in French.
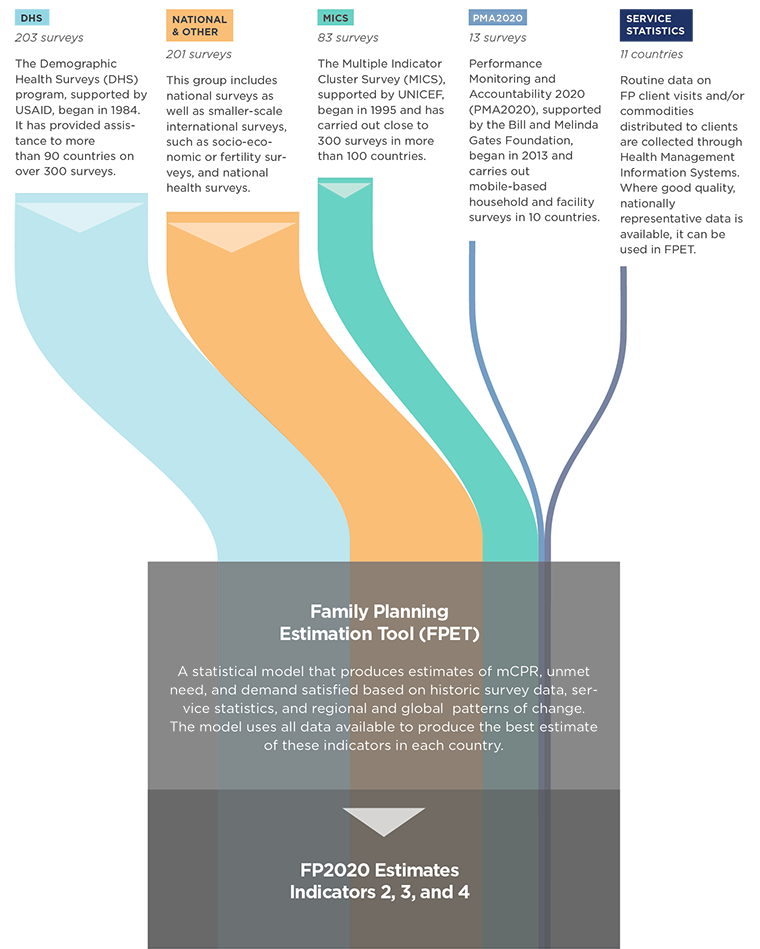
In order to address the need for annual estimates of Family Planning indicators as part of the FP2020 initiative, the Family Planning Estimation Tool (FPET) was produced by the Track20 Project, in collaboration with the United Nations Population Division (UNPD) and the National University of Singapore.
FPET projects annual estimates for contraceptive prevalence and the percentage of women with an unmet need for contraception, based on all available survey data and service statistics data, where available. Depending on what data is entered into the tool, FPET can be used to produce either national or sub-national estimates.
FPET is a Bayesian hierarchical model.
A Bayesian hierarchical model is a statistical model that estimates the likelihood of a given result based on prior observed values, and is informed by data at multiple levels.
For the purpose of producing annual estimates of contraceptive prevalence, these models incorporate:
- multiple sources of data (different surveys: National, DHS, MICS, PMA, etc)
- data points over time (survey results and trends: CPR, mCPR, Unmet Need)
- different levels of data (country/region/global)
Source: FP2020 MOMENTUM AT THE MIDPOINT 2015-1016: Methodology Notes
Using this information, the model aims to provide the best estimate of those data points that haven't been observed through a survey (mCPR in a year without a survey and future projections of mCPR).
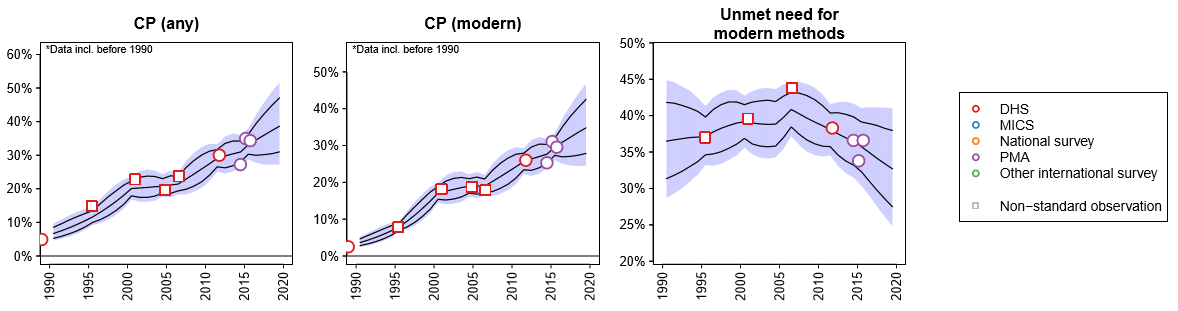
The graphs on the right are an examples of the output from FPET. In these graphs, the individual circles and squares represent all the available survey estimates of mCPR among married women, from 1980 to 2015.
The grey area represents the full range of possible values, while the middle black line represents the median estimate. This median value is what is used as the best estimate of annual mCPR among married women for Track20 and FP2020.